
The 2026 Buyer's Guide to Crypto Market Analysis Tools: On-Chain, Funding & Sentiment
By Mag-Info Tech editorial · 2026-06-07

Introduction: Beyond Price Charts
For the serious crypto trader or investor, price action alone tells only a fraction of the story. To truly understand market dynamics, one must peer beneath the surface at the foundational data: the flow of coins on the blockchain, the cost of leverage, the cascade of forced liquidations, and the collective mood of market participants. This realm of market analysis—encompassing on-chain metrics, funding data, liquidation maps, and sentiment indicators—requires specialized tools designed to decode these complex signals. The landscape of these platforms has matured dramatically, moving from niche services to essential suites for institutional and retail analysts alike. This guide is designed to cut through the noise, helping you identify which platforms align with your specific needs, budget, and expertise level in 2026.
The challenge for users is no longer a lack of data, but an overload of it. Each tool promises a unique lens on the market, yet they often overlap in features while differing sharply in data depth, presentation, and intended audience. A quantitative researcher building algorithmic models has vastly different needs from a swing trader trying to gauge local tops and bottoms, or an investor assessing the long-term health of a network. Choosing the right platform is not about finding the "best" one in a vacuum, but about finding the "best one for you." This guide breaks down the leading options by their core competencies, outlines practical selection criteria, and highlights common pitfalls to avoid on your quest for clarity.
The Pioneers: On-Chain Data Titans
On-chain analysis is the bedrock of modern crypto market intelligence, providing an immutable record of network activity. The leading tools in this space differ in their philosophy: some focus on creating intuitive, all-in-one dashboards for broad exploration, while others provide the raw, granular data and APIs for deep, custom research. Understanding this distinction is key. A platform like Glassnode is renowned for its exhaustive library of indicators, from basic metrics like active addresses to sophisticated models like the MVRV Z-Score. It excels at providing historical context and enabling users to identify macro cycles. Its interface, while powerful, can present a steep learning curve for newcomers due to the sheer density of information. It is best suited for analysts, researchers, and investors who want to build a comprehensive, data-driven thesis on network health and market cycles.
Conversely, platforms like Nansen have carved out a niche by focusing less on aggregate network metrics and more on wallet-labeling and entity tracking. Nansen’s strength lies in answering the question, "Who is doing what?" It identifies and tags wallets belonging to funds, exchanges, miners, and high-net-worth individuals, allowing users to follow the "smart money." This makes it exceptionally powerful for tracking capital flows, understanding exchange dynamics, and spotting trends in DeFi participation. For a trader looking for actionable signals based on the movements of influential players, or for conducting due diligence on a token’s investor base, Nansen’s curated labels and alerting systems provide a more targeted, narrative-driven form of on-chain analysis. The choice between these types of platforms often comes down to whether you prioritize broad, model-based market analysis or specific, entity-focused capital flow tracking.

Deciphering Market Leverage: Funding & Liquidation Tools
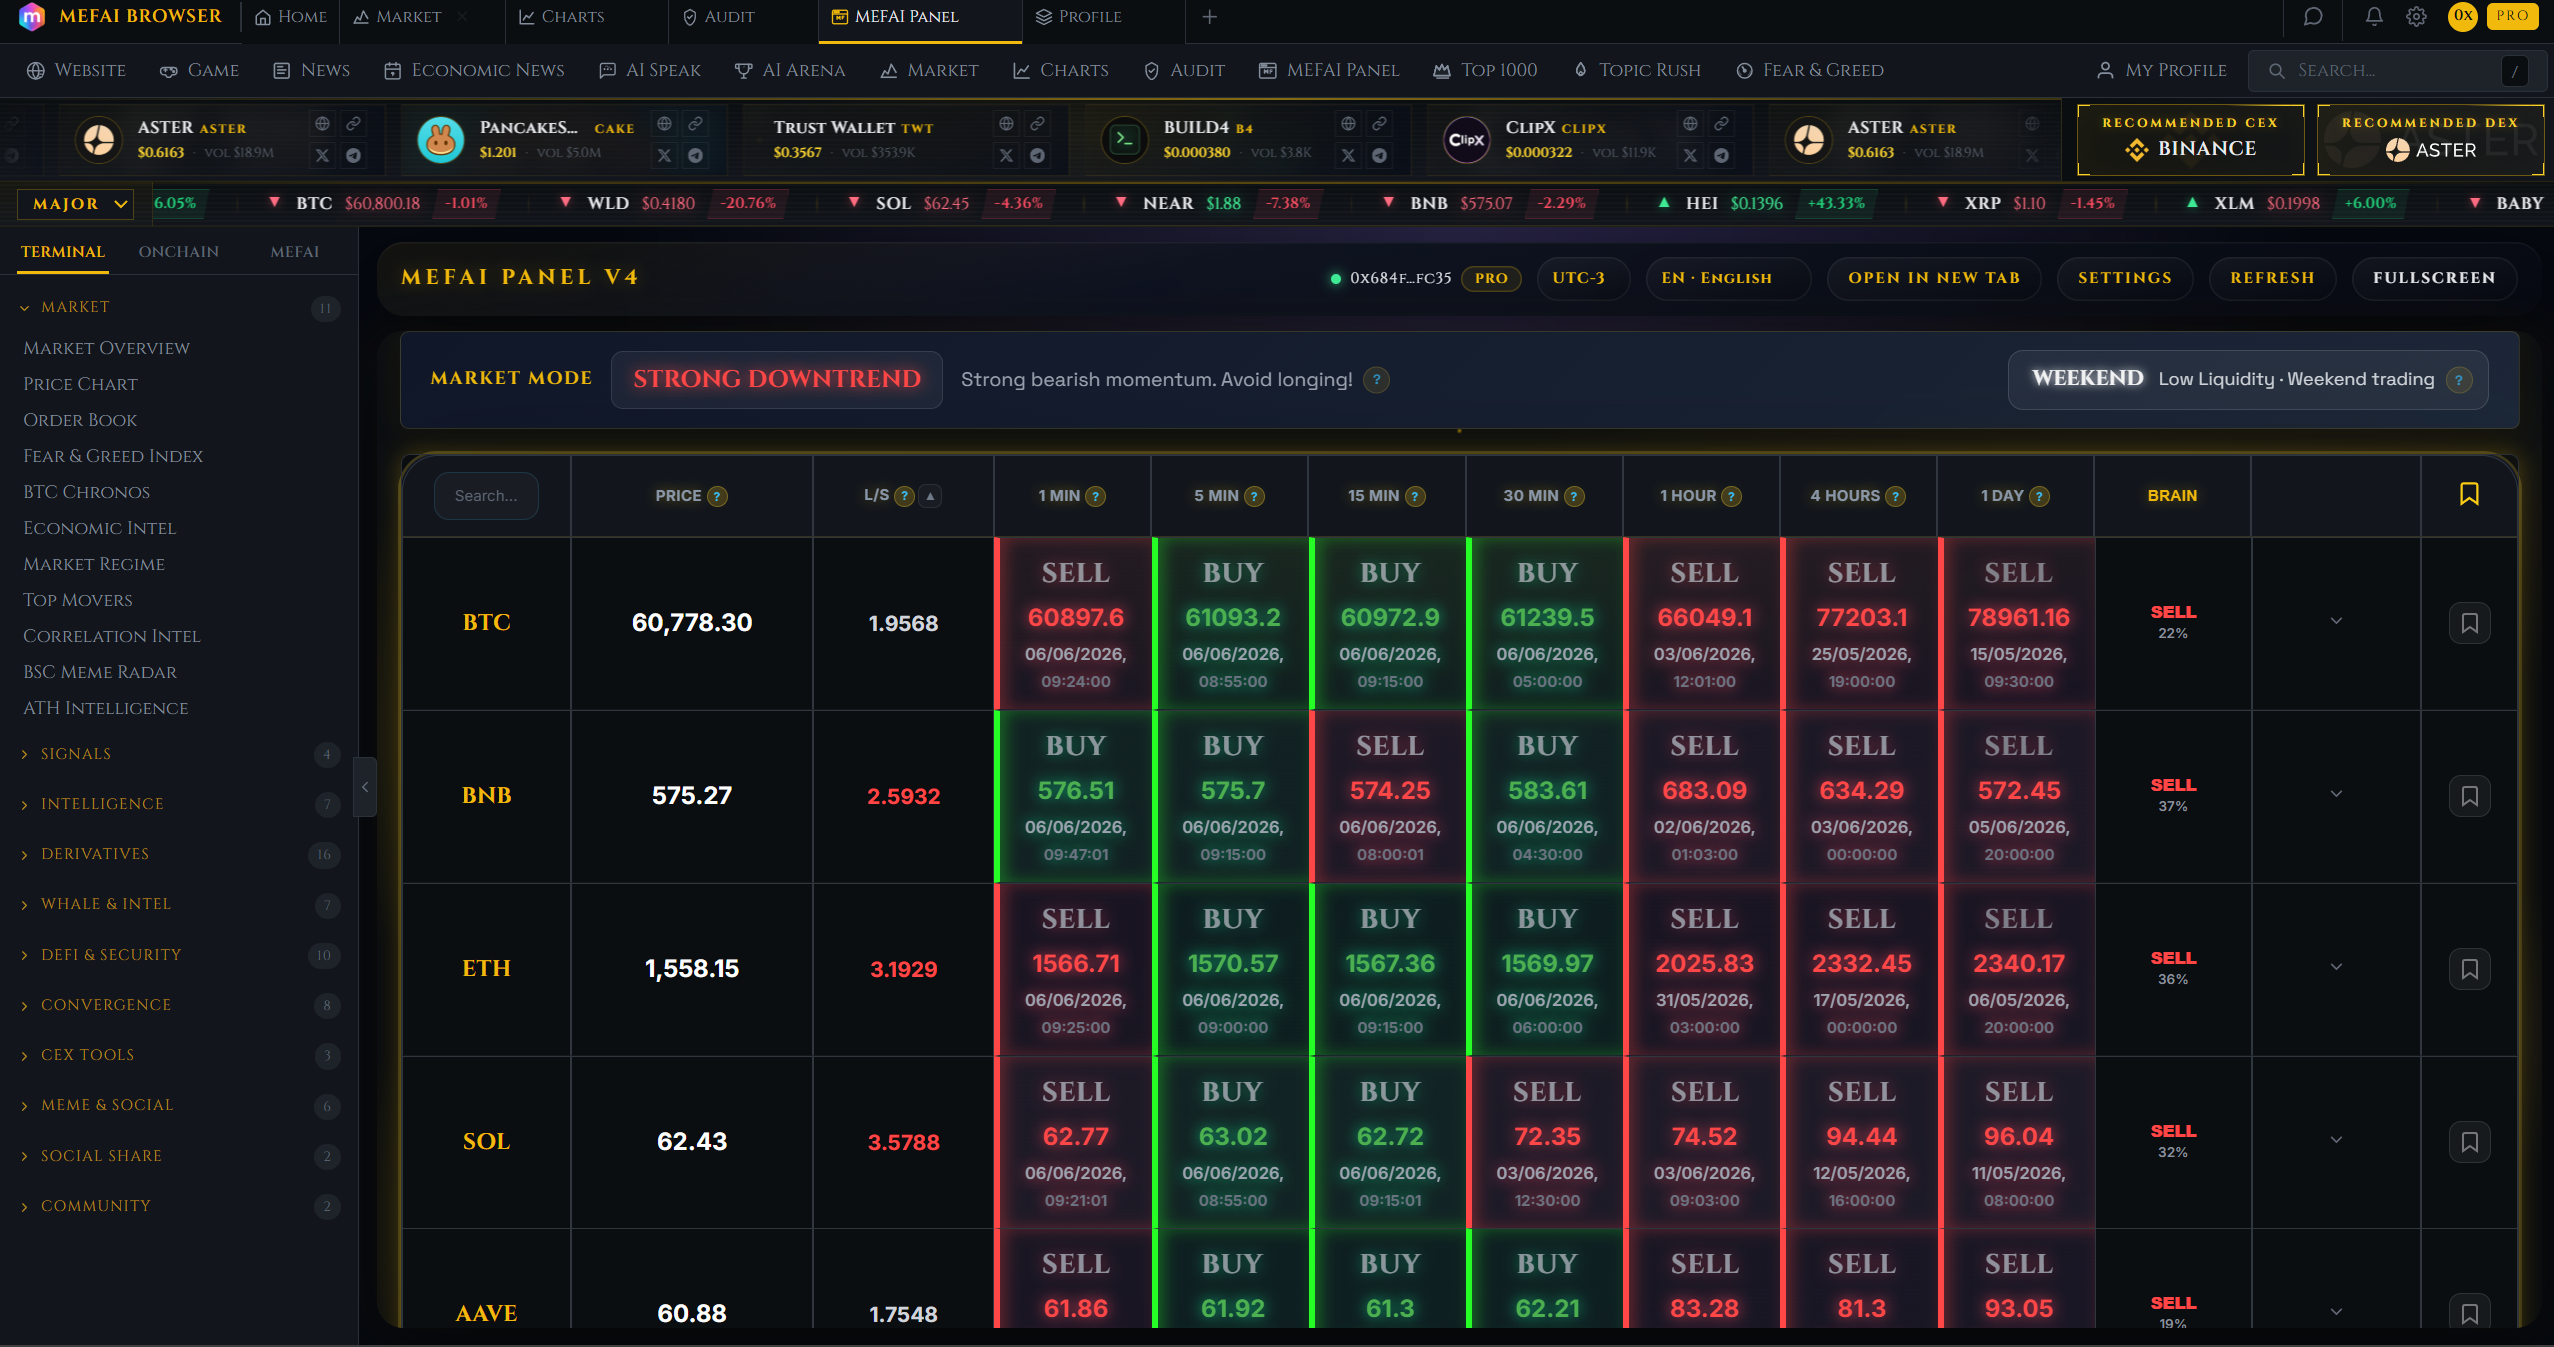
In a market heavily influenced by derivatives, understanding leverage is non-negotiable. Funding rates—the periodic payments between long and short perpetual futures traders—act as a barometer for market bias. Persistently high positive funding rates can indicate an over-leveraged long market, vulnerable to a correction. Dedicated tools and dashboards from exchanges and analytics platforms specialize in visualizing these rates across different assets and exchanges. They often present this data in real-time charts and heatmaps, making it easy to spot divergences between different trading venues. For active traders, monitoring funding is crucial for assessing the sustainability of a price move and for informing contrarian strategies, as extreme readings can precede violent reversals.
Closely related is the monitoring of liquidations. When the market moves against leveraged positions, those positions are forcibly closed, often fueling further price momentum in a cascade effect. Liquidation maps, offered by platforms like Coinglass or within advanced trading terminals like TradingView, visualize where clusters of liquidation orders reside at various price levels. This creates a map of potential support and resistance, as market makers or large players might target these areas to trigger cascades and profit from the volatility. These tools are indispensable for short-term traders managing risk and for those looking to anticipate periods of high volatility. They transform the abstract concept of "stop-loss hunting" into a visual, probabilistic model of market mechanics, helping traders position themselves more strategically.
Gauging the Crowd: Sentiment Analysis Platforms
Sentiment analysis tools aim to quantify the often-intangible mood of the market. They aggregate data from a vast array of sources, including social media platforms like X (formerly Twitter), Telegram, Reddit, and crypto-specific forums. By applying natural language processing and machine learning, they distill millions of posts into actionable metrics like social volume, sentiment scores (positive vs. negative), and mentions of specific assets. A sudden, massive spike in social volume for a particular token, for instance, can be an early indicator of a grassroots movement or a coordinated campaign. Tools like Santiment excel at this, providing a multi-faceted view that combines social metrics with on-chain and development activity data, offering a holistic picture of a project's momentum and community health.

Real results from MEFAI's AI. Get $50 off the Pro plan.
Sponsored · Past performance is not indicative of future results. Not financial advice.
However, sentiment data must be interpreted with extreme caution. The crypto social landscape is rife with bots, paid promoters, and coordinated "shilling," which can easily skew raw metrics. The most effective platforms do not just report volume; they attempt to provide context, such as measuring the influence of accounts mentioning a topic or analyzing the sentiment specifically within high-quality, filtered conversations. For a trader, sentiment indicators are rarely a standalone signal but are powerful when used in confluence with on-chain or technical data. For instance, if on-chain data shows accumulation by long-term holders while social sentiment is overwhelmingly negative (a "bottom" signal), it can present a compelling opportunity. The key is to use sentiment tools to understand the narrative and its intensity, not to take it at face value.

How to Choose: A Practical Selection Framework
Selecting the right tool requires a honest assessment of your primary goals, technical proficiency, and budget. Start by defining your core question: Are you a long-term investor trying to assess Bitcoin's cycle? A DeFi trader monitoring leveraged yields? A researcher analyzing fund flows? Match your need to the tool's core competency. If your work is research-heavy and requires building custom dashboards or pulling large datasets for modeling, prioritize platforms with robust, well-documented APIs and extensive historical data archives. If you need quick, actionable alerts on social buzz or smart money movements, a platform with strong mobile apps and notification systems is more valuable.
Next, consider the learning curve versus the depth of insight you require. Some platforms offer "lite" or free versions that provide a good starting point, allowing you to test the interface and data before committing to a subscription. It is critical to utilize these trials. A platform that seems powerful but whose interface you never master provides zero value. Finally, evaluate the platform's ecosystem. Does it integrate well with your existing charting software or trading terminal? Can its data feeds be plugged into other analytical tools you use? The most powerful analysis often comes from synthesizing information from multiple specialized sources, so the ability to combine insights from an on-chain tool with a sentiment dashboard and a derivatives data feed is a significant advantage.
Common Pitfalls and Critical Mistakes
One of the most frequent mistakes is overcomplication and "analysis paralysis." In the quest for the perfect signal, users can become overwhelmed by a flood of indicators, leading to indecision. Remember that no single metric is a holy grail. On-chain data can show you a trend, but not its timing. Sentiment can show you hype, but not its quality. Liquidation levels can show you potential targets, but not the catalyst that will push the price there. The goal is to build a confluence of evidence, not to find a single, perfect number that predicts the future. Start with a few key metrics that align with your strategy and add complexity only as your understanding deepens.
Another critical error is neglecting data context and historical precedent. A funding rate of 0.1% means something entirely different in a bear market versus a bull market peak. A spike in exchange outflows could signal long-term holding or simply be a precursor to a move to a DeFi platform. Effective tools provide not just the current number but also historical percentiles, averages, and the ability to compare it to past cycles. Failing to use this historical context is like reading a single sentence of a novel and trying to understand the plot. Always ask, "Is this normal? When have we seen this before, and what happened next?" This contextual analysis transforms raw data into genuine insight and is the hallmark of a sophisticated market analyst.

Conclusion: Building Your Intelligence Stack
The ideal crypto market analysis setup in 2026 is rarely a single platform, but a curated "intelligence stack" tailored to your specific workflow. A portfolio investor might rely primarily on an on-chain titan for macro trends, supplemented by a sentiment tool for news flow. An active derivatives trader would likely center their workflow around real-time funding and liquidation dashboards, cross-referenced with on-chain exchange flow data to spot potential manipulation. The key is to invest time in understanding the distinct language each type of data speaks—on-chain for fundamental flows, derivatives for leverage and positioning, and sentiment for narrative and psychology.
Ultimately, these tools provide clarity and perspective in an opaque market. They empower you to move beyond speculation and react to the actual mechanics of the crypto economy. The "best" tool is the one that efficiently and accurately answers your most important questions, integrates into your decision-making process, and, above all, you understand deeply enough to interpret its signals correctly within the broader market context. Start with a focused need, master one or two key data streams, and expand your toolkit as your strategy and expertise evolve.
More in Crypto & Trading

Crypto Money Meets British Politics: The Nigel Farage Tether Gift Scandal Explained
Reform UK's Nigel Farage faces scrutiny over a £5M gift from Tether billionaire Christopher Harborne, raising questions about crypto money in politics and UK regulatory transparency.

South Korea’s Crypto Crackdown: How a Political Nepotism Probe Is Reshaping Exchanges and Regulation
A South Korean lawmaker’s alleged influence over his son’s hiring at crypto exchanges has triggered police raids and a wider probe into hiring practices at Bithumb and Upbit, signaling tougher scrutin

Bitcoin and Ether Suffer Worst Weekly Rout Since FTX Collapse as Crypto Shed $390 Billion
Bitcoin and ether posted their steepest weekly losses since the November 2022 FTX collapse, wiping out roughly $390 billion in crypto market value and triggering nearly $7 billion in leveraged liquida